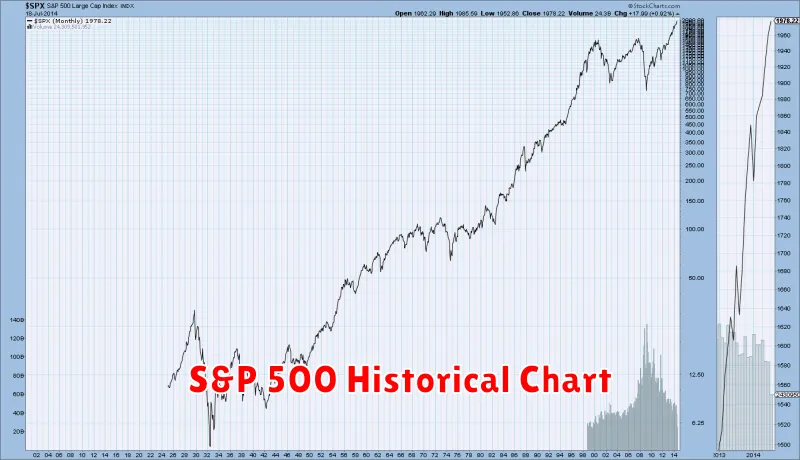
Are you looking to understand the S&P 500 and how it can potentially impact your investments? Look no further! This comprehensive analysis will delve into the historical performance of the S&P 500, unraveling the trends and patterns that have shaped its trajectory. We will examine key factors that have driven its returns, including economic growth, inflation, and interest rates. By understanding the historical context, we can gain valuable insights into potential future performance, empowering you to make informed investment decisions.
Beyond analyzing the past, we will explore current market conditions and expert projections for the S&P 500’s future. We’ll discuss potential risks and opportunities that investors should be aware of, considering factors such as technological advancements, geopolitical uncertainties, and evolving consumer behavior. By incorporating historical data and expert forecasts, this analysis aims to provide a nuanced perspective on the S&P 500, guiding you towards a more comprehensive understanding of its potential for growth and volatility.
A Historical Overview of the S&P 500
The S&P 500, a market-capitalization-weighted index that tracks the performance of 500 large-cap U.S. companies, stands as a cornerstone of global finance. Its origins trace back to 1923, initially as a compilation of 90 prominent stocks, evolving to its current format in 1957. This evolution reflects a shifting landscape of the American economy and market, with the S&P 500 reflecting the growth and diversification of the U.S. stock market.
The index has weathered numerous economic storms, including the Great Depression, the dot-com bubble burst, and the 2008 financial crisis. These events have demonstrably impacted the S&P 500, highlighting its cyclical nature. However, despite periods of volatility, the index has shown a remarkable capacity for long-term growth, demonstrating the resilience and potential of the U.S. stock market.
Examining historical performance unveils a compelling narrative. The S&P 500 has averaged an annualized return of approximately 10% since its inception, including dividends. This long-term growth trend, punctuated by both significant gains and setbacks, underscores the potential for investors to achieve substantial returns over extended periods.
Understanding the historical performance of the S&P 500 provides a valuable context for assessing future prospects. While past performance is not indicative of future results, the index’s consistent long-term growth suggests its potential to remain a key benchmark for investors seeking to navigate the complexities of the U.S. stock market.
Understanding the Index’s Composition
The S&P 500 is a market-capitalization-weighted index, meaning that larger companies have a greater influence on its performance. It comprises 500 of the largest publicly traded companies in the United States, representing a diverse range of sectors, including technology, healthcare, financials, consumer discretionary, and more.
The index is designed to be a representative benchmark of the U.S. stock market. However, it’s important to note that the S&P 500 is not a comprehensive measure of all U.S. stocks. Smaller companies, privately held companies, and companies listed on other exchanges are not included.
The composition of the index is constantly evolving as companies are added, removed, or their weights adjusted. This dynamism reflects the evolving landscape of the U.S. economy. Understanding the index’s composition is crucial for investors seeking to make informed decisions about their portfolio.
Factors Influencing S&P 500 Performance
The S&P 500, a benchmark index tracking the performance of 500 large-cap U.S. companies, serves as a proxy for the overall health of the U.S. stock market. Its performance is influenced by a complex interplay of economic, political, and market-specific factors. Understanding these influences is crucial for investors seeking to navigate the dynamic world of stock investments.
Economic Factors play a significant role in S&P 500 performance. Interest rates set by the Federal Reserve directly impact corporate borrowing costs, influencing investment and growth. Inflation, a measure of price increases, impacts consumer spending and corporate profitability. Economic growth, measured by GDP, reflects overall economic activity and corporate revenue potential. Positive economic conditions typically lead to a robust S&P 500, while adverse economic conditions can cause market declines.
Political Factors also exert influence. Government policies, including tax laws, trade agreements, and regulatory changes, can impact corporate profitability and investor confidence. Geopolitical events, such as wars, conflicts, and global tensions, can create uncertainty and volatility in the market. Political stability and predictable policy environments tend to foster positive market sentiment and S&P 500 performance.
Market-Specific Factors, intrinsic to the stock market itself, significantly affect S&P 500 performance. Investor sentiment, characterized by optimism or pessimism, drives buying and selling decisions, influencing market direction. Market volatility, measured by price fluctuations, can be driven by economic, political, or market-specific events. High volatility often reflects uncertainty and can lead to short-term market fluctuations.
In conclusion, the S&P 500 performance is a product of various interconnected factors. Economic, political, and market-specific conditions constantly shape the market landscape, making it crucial for investors to stay informed and adaptable. Understanding these influences allows for more informed investment decisions and a better grasp of potential risks and opportunities.
Analyzing Past Market Trends and Cycles
Understanding past market trends and cycles is crucial for any investor looking to make informed decisions about their portfolio. By analyzing historical data, we can gain insights into the behavior of the S&P 500, a benchmark index representing the performance of 500 large-cap U.S. companies, and identify potential patterns that may provide clues to future performance. This analysis can help us understand the long-term growth potential of the market, identify periods of volatility and correction, and ultimately make better investment choices.
One important factor to consider is the long-term growth trend of the S&P 500. Over the past century, the index has consistently grown at an average annual rate of around 10%, adjusted for inflation. This long-term trend suggests that investing in the stock market, particularly over a longer time horizon, can potentially deliver significant returns.
However, it’s essential to acknowledge that market returns are not always smooth and linear. The S&P 500 has experienced numerous periods of volatility and correction throughout history. These corrections can be sharp and sudden, and understanding their causes and durations can help investors navigate these turbulent periods. By studying past market cycles, we can gain a better understanding of the factors that drive these fluctuations, such as economic conditions, interest rates, and geopolitical events.
In addition to analyzing past trends, we can also employ various tools and techniques to forecast future market performance. These methods may include fundamental analysis, which examines a company’s financial health and growth prospects, and technical analysis, which studies historical price and volume data to identify patterns and predict future price movements. While predicting the future with absolute certainty is impossible, understanding the factors that influence market behavior can help investors make more informed decisions and potentially mitigate risks.
Benchmarking Against Other Indices
While the S&P 500 is a widely recognized benchmark, it’s crucial to understand how it performs relative to other major indices. Comparing its returns to those of the Dow Jones Industrial Average, Nasdaq Composite, and Russell 2000 reveals important insights.
The Dow Jones Industrial Average, comprising 30 large-cap U.S. companies, often reflects the performance of blue-chip stocks. The Nasdaq Composite, dominated by technology and growth-oriented companies, provides a contrast to the S&P 500’s focus on a broader range of industries. The Russell 2000, tracking the performance of small-cap companies, offers a different perspective on market trends.
By comparing the historical returns and volatility of these indices, investors can gain valuable perspectives on the S&P 500’s performance within the broader market landscape. For example, during periods of economic expansion, the Nasdaq Composite might outperform the S&P 500 due to its concentration in growth sectors. Conversely, during periods of uncertainty, the Dow Jones Industrial Average, with its focus on established companies, could exhibit greater stability.
Ultimately, benchmarking against other indices provides a valuable context for evaluating the S&P 500’s performance. Understanding its strengths and weaknesses relative to other market segments helps investors make more informed decisions about portfolio allocation and investment strategies.
Predicting Future S&P 500 Returns
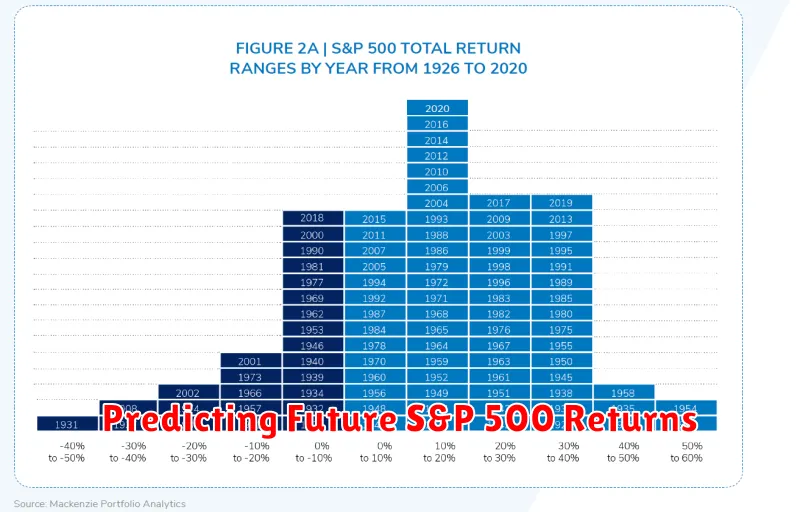
Predicting the future performance of the S&P 500 is a challenging task, fraught with uncertainty. While historical data provides insights into past trends, it’s crucial to remember that past performance is not indicative of future results. The stock market is influenced by numerous factors, including economic conditions, interest rates, inflation, geopolitical events, and investor sentiment, making it difficult to accurately forecast future returns.
Despite the challenges, several approaches are used to project future S&P 500 returns. These methods include:
- Historical Averages: This approach uses the average historical return of the S&P 500 over a specific period as a baseline for future expectations. However, this method ignores the dynamic nature of the market and may not be representative of current conditions.
- Fundamental Analysis: This approach focuses on analyzing the underlying economic fundamentals that drive stock prices, such as corporate earnings, economic growth, and interest rates. By evaluating these factors, analysts attempt to identify potential growth opportunities and risks.
- Quantitative Models: These models utilize statistical and mathematical techniques to analyze historical data and identify patterns that may predict future trends. However, their accuracy can be limited by the quality of data and the complexity of the models.
It’s important to note that even the most sophisticated forecasting methods have limitations. Market conditions are constantly evolving, and unforeseen events can significantly impact stock market performance. Therefore, investors should approach future return projections with a healthy dose of skepticism and avoid relying solely on any single method.
Instead of trying to pinpoint precise future returns, investors are better served by focusing on long-term investment goals and developing a diversified portfolio that aligns with their risk tolerance. While predicting the future of the S&P 500 is a difficult task, understanding the factors that influence market performance and adopting a disciplined approach to investing can help investors navigate the market effectively.
Investing Strategies for Different Market Conditions
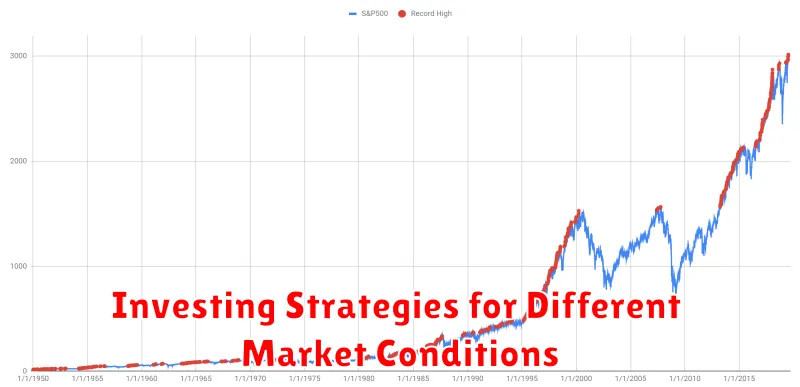
Navigating the dynamic landscape of the stock market requires a flexible approach, adapting investment strategies to prevailing market conditions. The S&P 500, a benchmark index of 500 large-cap U.S. stocks, provides valuable insights into historical returns and potential future trends, informing investment decisions. Let’s explore how to tailor investment strategies based on different market scenarios.
In a bull market, characterized by rising prices and optimism, growth-oriented strategies can flourish. Investors may favor sectors like technology, consumer discretionary, and healthcare, which tend to benefit from strong economic growth. Growth stocks with high potential for future earnings expansion often perform well in bull markets. However, it’s crucial to manage risk by diversifying across different asset classes and sectors, and by considering valuation metrics.
Conversely, a bear market, characterized by falling prices and pessimism, demands a more cautious approach. Value stocks, with lower valuations and potentially higher dividend yields, can provide some downside protection. Defensive sectors like utilities and consumer staples, less susceptible to economic downturns, may offer relative stability. During bear markets, it’s essential to maintain liquidity, avoid panic selling, and focus on long-term investment goals.
Volatility is inherent in the stock market, and periods of heightened uncertainty can present both risks and opportunities. In such instances, a balanced approach, combining growth and value stocks, can mitigate risk. Consider diversifying across global markets, incorporating alternative investments like real estate or commodities, and seeking out opportunities in undervalued sectors.
While past performance is not indicative of future results, analyzing historical data and understanding the underlying economic factors can provide valuable insights into potential market trends. Remember to consult with a qualified financial advisor to develop an investment strategy that aligns with your individual financial goals, risk tolerance, and time horizon.
The Role of Dividends in S&P 500 Returns
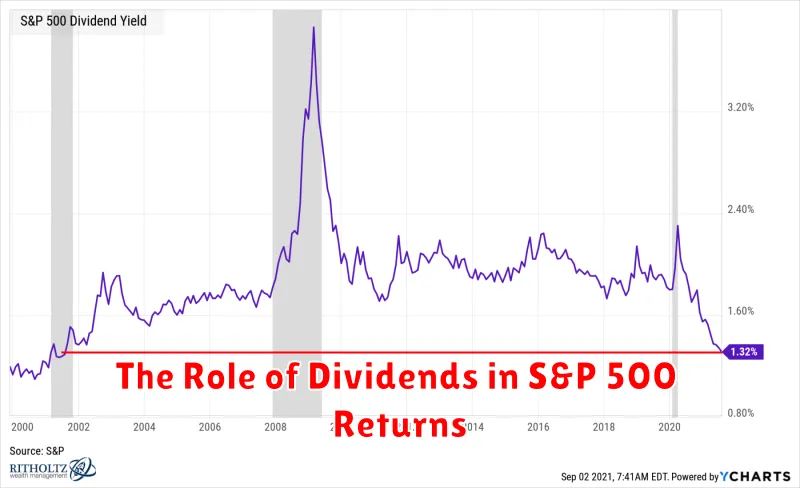
The S&P 500, a benchmark index for US equities, has historically provided investors with substantial returns. While price appreciation is often the main focus, dividends play a significant role in the overall performance of the index.
Dividends, payments made by companies to their shareholders, represent a portion of the company’s profits. For investors in the S&P 500, dividends contribute to total returns in two ways. First, they provide a direct stream of income, enhancing the cash flow from the investment. Second, dividends are reinvested back into the index, fueling further growth and compounding returns over time.
Historically, dividends have accounted for a considerable portion of the S&P 500’s total returns. According to data from Schwab, dividends have contributed approximately 30% to 40% of the S&P 500’s total returns over the long term. This highlights the significance of dividends as a key driver of overall investment performance.
While past performance doesn’t guarantee future results, it suggests that dividends will likely remain a valuable component of S&P 500 returns in the future. As companies continue to generate profits and distribute them to shareholders, dividends will contribute to both income generation and long-term growth, enhancing the overall value proposition for investors.
S&P 500 ETFs and Index Funds
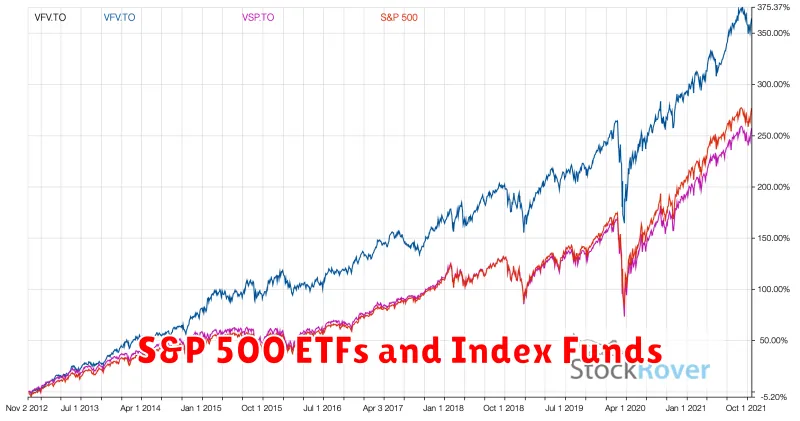
The S&P 500 is one of the most widely followed stock market indexes, representing a broad basket of 500 large-cap U.S. companies. Investors have a variety of ways to gain exposure to the S&P 500, with exchange-traded funds (ETFs) and index funds being two popular options.
S&P 500 ETFs are traded on stock exchanges like regular stocks. They track the performance of the S&P 500, allowing investors to buy and sell shares throughout the day. ETFs offer several advantages, including:
- Diversification: ETFs provide instant diversification across a large number of companies.
- Liquidity: ETFs are easily bought and sold on exchanges, offering high liquidity.
- Low expense ratios: Most S&P 500 ETFs have low expense ratios, keeping costs down.
S&P 500 index funds, on the other hand, are mutual funds that track the S&P 500 index. They are bought and sold at the end of each trading day, based on their net asset value (NAV). Index funds offer similar benefits as ETFs, including:
- Passive management: Index funds aim to replicate the performance of the index, avoiding active stock picking.
- Low risk: Tracking a broad market index like the S&P 500 generally reduces portfolio risk.
- Tax efficiency: Index funds typically have lower turnover rates, resulting in fewer taxable events.
Both S&P 500 ETFs and index funds offer cost-effective ways to gain exposure to the U.S. stock market. When choosing between them, consider factors like trading frequency, expense ratios, and tax implications. Ultimately, the best choice depends on your individual investment goals and preferences.

