Navigating the stock market can feel like a daunting task, especially for investors who are new to the world of financial trading. But fear not! Understanding the complexities of the market is achievable with the help of stock market performance reports. These reports provide valuable insights into market trends, allowing you to make informed decisions and optimize your investment strategies. By analyzing historical data and current market conditions, you gain a comprehensive view of the overall market landscape, empowering you to identify promising opportunities and potential risks.
Whether you’re a seasoned investor or just starting your financial journey, stock market performance reports are essential tools for staying ahead of the curve. These reports delve into the performance of various sectors, industries, and individual companies, offering a detailed breakdown of market dynamics. With this information at your fingertips, you can make strategic moves, capitalize on growth opportunities, and mitigate potential losses. Get ready to unlock the secrets of the stock market and gain a competitive edge with our insightful analysis of stock market performance reports.
Understanding Different Types of Stock Market Indices
Stock market indices are crucial tools for investors to understand the overall performance of the market. They serve as benchmarks that track the movement of a group of stocks, providing valuable insights into market trends. These indices are calculated based on the weighted average of the prices of the underlying securities, reflecting the performance of a specific sector, industry, or the market as a whole.
Understanding the different types of stock market indices is essential for investors to make informed decisions. Here’s a breakdown of some common types:
Broad Market Indices
Broad market indices represent the overall performance of a stock market. They encompass a large number of companies across various sectors. Examples include:
- S&P 500: This index tracks the performance of 500 large-cap U.S. companies, representing roughly 80% of the total market capitalization.
- Dow Jones Industrial Average (DJIA): It comprises 30 of the largest publicly traded companies in the U.S., often considered a barometer of the American economy.
- Nasdaq Composite: This index focuses on the performance of companies listed on the Nasdaq Stock Market, particularly technology companies.
Sector Indices
Sector indices focus on specific industries or sectors within the market. They provide insights into the performance of a particular industry and offer opportunities for investors seeking sector-specific exposure. Examples include:
- Energy Select Sector SPDR Fund (XLE): Tracks the performance of U.S. energy companies.
- Health Care Select Sector SPDR Fund (XLV): Represents the performance of U.S. healthcare companies.
- Technology Select Sector SPDR Fund (XLK): Tracks the performance of U.S. technology companies.
International Indices
International indices track the performance of stock markets outside the United States. They provide investors with exposure to global markets and opportunities to diversify their portfolios. Examples include:
- MSCI EAFE Index: Tracks the performance of developed markets outside the U.S. and Canada.
- MSCI Emerging Markets Index: Represents the performance of emerging markets, such as China, India, and Brazil.
Understanding Indices for Investment Decisions
By understanding the different types of stock market indices, investors can gain a clearer picture of market trends and make informed investment decisions. They can analyze the performance of specific sectors or industries, compare different markets, and identify potential investment opportunities based on their risk tolerance and financial goals.
Analyzing Historical Market Performance: Trends and Patterns

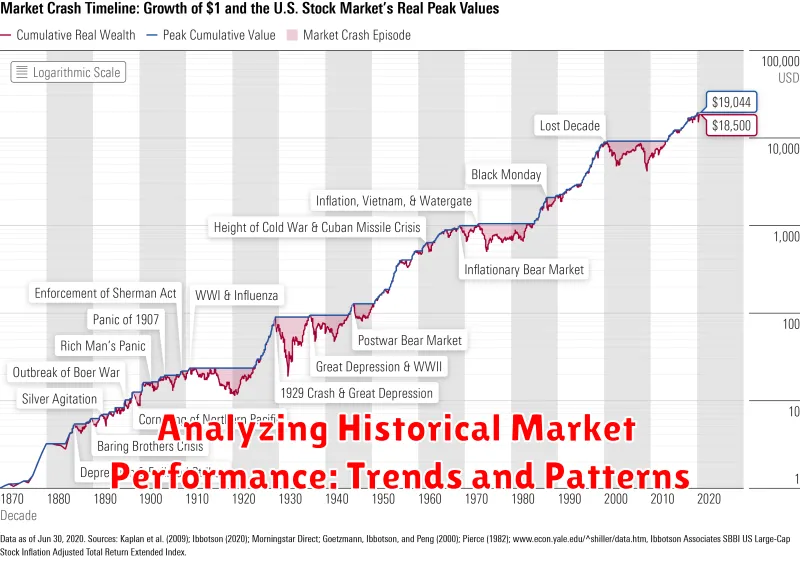
Understanding historical market performance is crucial for making informed investment decisions. By analyzing past trends and patterns, investors can gain valuable insights into potential future market movements. This article explores key aspects of historical market analysis, focusing on identifying recurring trends and patterns that can help investors navigate market volatility.
Identifying Market Cycles
The stock market exhibits cyclical patterns, often characterized by periods of expansion and contraction. Identifying these cycles, such as the bull and bear markets, can help investors understand the overall market sentiment and potential turning points. Analyzing historical data can reveal the duration and intensity of past cycles, providing a framework for understanding current market conditions.
Analyzing Sector Performance
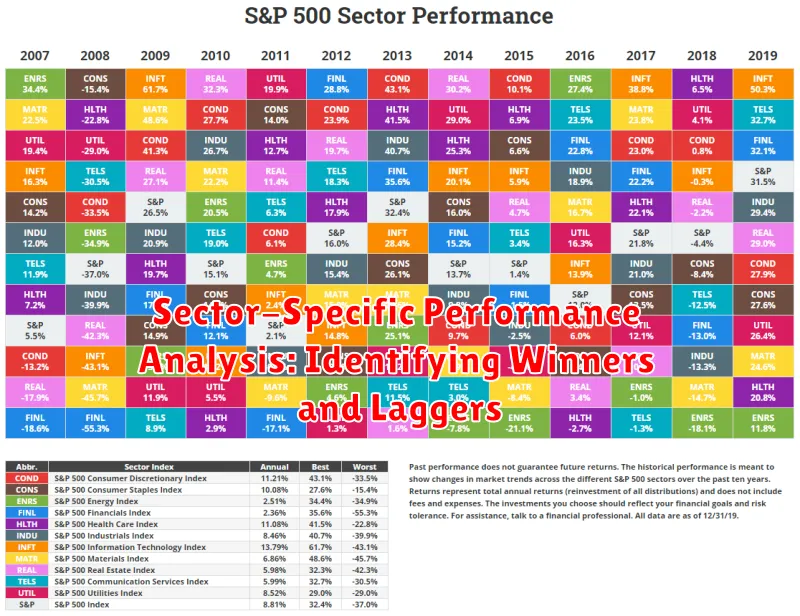
Different sectors within the market often exhibit unique performance patterns. For example, technology stocks might outperform during periods of economic growth, while defensive sectors like utilities might perform better during economic downturns. Examining historical sector performance can help investors identify industries that have consistently outperformed or underperformed over time.
Understanding Market Sentiment
Market sentiment, often reflected in investor psychology, can significantly impact market direction. By analyzing historical data, investors can identify periods when sentiment was overly bullish or bearish, and how these shifts influenced market performance. This information can help investors understand the current market mood and its potential implications for future returns.
Key Performance Indicators (KPIs)
Various KPIs, such as the S&P 500 Index, provide valuable insights into market performance. Analyzing historical data of these KPIs can reveal trends, volatility, and potential correlations with other economic indicators. This information can assist investors in making informed decisions based on historical data and expected future trends.
Importance of Data-Driven Decisions
Analyzing historical market performance is not about predicting the future but rather understanding the past to make better-informed decisions. By recognizing trends and patterns, investors can approach investment strategies with a data-driven perspective, enhancing their chances of achieving long-term financial goals.
Factors Influencing Stock Market Performance
The stock market is a complex and dynamic system influenced by a multitude of factors. Understanding these factors is crucial for investors seeking to make informed decisions and navigate the market effectively.
Economic Indicators play a significant role in shaping market sentiment. Key indicators such as Gross Domestic Product (GDP) growth, inflation rates, unemployment levels, and consumer confidence provide insights into the overall health of the economy and impact investor expectations.
Company-Specific Factors also contribute to stock price fluctuations. Strong financial performance, innovative products and services, effective management, and market share growth are all indicators of a company’s ability to generate profits and enhance shareholder value.
Geopolitical Events can have a profound impact on market volatility. Wars, political instability, and trade tensions create uncertainty and can lead to market corrections or rallies, depending on the nature of the events.
Interest Rates set by central banks influence borrowing costs for businesses and consumers. Higher interest rates tend to dampen economic growth and make borrowing more expensive, which can negatively impact stock prices. Conversely, lower interest rates can stimulate economic activity and encourage investment.
Investor Sentiment plays a crucial role in driving market trends. Market psychology, media coverage, and investor confidence levels can significantly impact stock prices, leading to market bubbles or crashes.
Technological Advancements can create new opportunities and disrupt existing industries. Innovation, technological breakthroughs, and digital transformation can drive growth in specific sectors and impact stock market performance.
Understanding these factors and their interplay is essential for investors to make informed decisions. By analyzing economic data, company fundamentals, geopolitical events, interest rate policies, investor sentiment, and technological trends, investors can gain insights into the forces shaping the stock market and develop effective investment strategies.
Interpreting Key Performance Metrics: Volume, Volatility, and Returns
Understanding the key performance metrics of a stock market is crucial for investors to make informed decisions. While return, a measure of profitability, is often the primary focus, other important indicators include volume and volatility.
Volume refers to the number of shares traded in a specific period. High volume indicates strong interest in a stock, potentially signaling a significant price movement. Conversely, low volume may suggest a lack of interest and limited price impact.
Volatility, on the other hand, measures the degree of price fluctuations over a certain period. High volatility signifies rapid price swings, making it a riskier investment. Conversely, low volatility suggests a stable and less volatile market. Analyzing volatility helps investors understand the risk associated with a particular stock or index.
By analyzing volume and volatility in conjunction with returns, investors can gain valuable insights into market trends. For instance, a sharp increase in volume alongside a significant price rise can indicate a strong bullish trend. However, if volume is low despite a price increase, it may suggest a lack of conviction and potential for a reversal.
In conclusion, understanding and interpreting these key performance metrics is essential for investors. They provide valuable clues about market sentiment, investor activity, and potential future trends, allowing for more informed investment decisions.
Sector-Specific Performance Analysis: Identifying Winners and Laggers

Understanding sector-specific performance is crucial for investors seeking to make informed decisions. By analyzing the performance of different sectors, investors can identify winners and laggers in the market, gaining valuable insights into the current economic landscape. This analysis helps investors to make strategic allocations, identify potential growth opportunities, and manage risk effectively.
Sectors often exhibit varying levels of performance due to factors such as economic cycles, industry trends, and regulatory changes. For example, during periods of economic growth, sectors like technology and consumer discretionary tend to perform well. Conversely, during economic downturns, defensive sectors such as healthcare and utilities may offer greater stability.
To identify winners and laggers, investors can use various analytical tools. Performance metrics like sector indices, price-to-earnings ratios, and dividend yields provide valuable insights into sector-specific growth and profitability. Fundamental analysis involves examining the underlying factors driving sector performance, including industry trends, competitive landscape, and regulatory environment. Technical analysis helps identify patterns and trends in sector price movements, providing insights into potential future performance.
By conducting a comprehensive sector-specific performance analysis, investors can gain a deeper understanding of the market dynamics and identify investment opportunities that align with their individual goals and risk tolerance. This analysis empowers investors to make informed decisions, potentially maximizing returns while minimizing risks.
Global Market Performance Comparisons
Global market performance comparisons provide valuable insights into the relative strength and weakness of different economies and asset classes. By analyzing the performance of major stock indices, investors can gain a better understanding of global economic trends and identify potential investment opportunities.
Key Performance Indicators: When comparing global market performance, it’s crucial to consider key indicators such as:
- Stock Indices: The S&P 500 (United States), FTSE 100 (United Kingdom), DAX (Germany), Nikkei 225 (Japan), and Hang Seng Index (Hong Kong) are some of the most widely followed indices.
- Currency Exchange Rates: Fluctuations in currency exchange rates can significantly impact the performance of foreign investments.
- Interest Rates: Interest rate differentials between countries can influence capital flows and investment decisions.
- Economic Growth: Strong economic growth generally leads to better stock market performance, while slow growth or recession can have negative effects.
Factors Influencing Market Performance: Global market performance is influenced by a multitude of factors, including:
- Geopolitical Events: Wars, trade disputes, and political instability can create market volatility.
- Monetary Policy: Central bank policies, such as interest rate adjustments, can impact market sentiment.
- Inflation: High inflation can erode purchasing power and hurt corporate profits, potentially leading to lower stock prices.
- Technological Advancements: Technological breakthroughs can create new industries and investment opportunities.
Benefits of Global Market Comparisons:
- Diversification: Investing in a variety of global markets can reduce overall portfolio risk.
- Opportunity Identification: By identifying strong performing markets, investors can allocate capital to regions with higher growth potential.
- Global Economic Insights: Comparisons provide insights into the health of global economies and the factors driving market trends.
Using Performance Reports for Investment Decisions
Performance reports are crucial tools for investors seeking to understand the overall health and potential of their investments. These reports provide a comprehensive overview of various aspects, including historical returns, risk levels, and investment strategies employed. By carefully analyzing these reports, investors can gain valuable insights to inform their investment decisions.
One key aspect of performance reports is the historical return data. This data shows the past performance of an investment over a specific period. Investors can use this information to assess the consistency and potential for future growth. For example, a stock with a consistent track record of high returns may indicate a strong and reliable investment. However, it’s essential to remember that past performance is not always indicative of future results.
Another critical element is the risk assessment. Performance reports often highlight the level of risk associated with an investment. This information helps investors understand the potential volatility and downside risks. For instance, high-growth investments typically carry higher risk, while more conservative investments may offer lower returns but greater stability. Understanding risk levels allows investors to make informed decisions based on their individual risk tolerance.
Furthermore, performance reports often provide details about the investment strategies employed. These insights help investors understand the underlying approach and philosophy behind the investment. This information can be particularly valuable when comparing different investment options. For instance, a report showcasing a value-based investment strategy may appeal to investors seeking long-term growth, while a growth-oriented strategy may attract those seeking higher potential returns.
By diligently reviewing and analyzing performance reports, investors can gain a better understanding of their investment portfolio’s performance, identify potential areas for improvement, and make informed decisions based on their investment goals and risk tolerance.
Benchmarking Portfolio Performance Against Market Indices
Benchmarking your portfolio’s performance against market indices is crucial for understanding how well your investments are performing. This process involves comparing your portfolio’s returns to the returns of widely recognized market indices, such as the S&P 500 or the Nasdaq 100.
By benchmarking, you can gain valuable insights into your portfolio’s strengths and weaknesses. For example, if your portfolio is outperforming the market, it suggests that your investment strategy is effective. However, if it is underperforming, it may be a sign that you need to adjust your approach.
There are several benefits to benchmarking your portfolio performance:
- Provides a clear picture of your portfolio’s performance relative to the overall market.
- Helps you identify areas where your portfolio may be underperforming.
- Facilitates a more objective assessment of your investment strategy.
- Provides a basis for making informed decisions about portfolio adjustments.
When benchmarking, it’s essential to choose relevant indices that reflect your portfolio’s investment style and risk tolerance. For example, if you have a portfolio heavily invested in technology stocks, benchmarking against the Nasdaq 100 would be more appropriate than the S&P 500.
By regularly benchmarking your portfolio performance, you can stay informed about your investment progress, make necessary adjustments, and ultimately, achieve your financial goals.
The Role of Economic Indicators in Performance Analysis
Economic indicators play a crucial role in analyzing stock market performance. These indicators provide insights into the overall health of the economy, which can significantly influence market trends. By understanding the relationship between economic data and market movements, investors can gain valuable insights to inform their investment decisions.
Leading indicators, such as manufacturing activity and consumer confidence, are often used to predict future economic growth. When these indicators show positive signs, it suggests that the economy is expanding and could lead to increased stock market valuations. Conversely, negative leading indicators could signal an economic slowdown and potentially lead to market decline.
Lagging indicators, such as unemployment rates and inflation, reflect past economic performance. While they don’t provide immediate insights into future market trends, they can offer valuable context and confirm existing economic patterns. For example, a declining unemployment rate can indicate a strong economy and support stock market growth.
Coincident indicators, such as industrial production and retail sales, provide a snapshot of current economic activity. These indicators can be used to assess the current state of the economy and provide immediate insights into market performance. A surge in industrial production, for instance, could indicate strong economic growth and positive market sentiment.
By carefully analyzing economic indicators, investors can gain a deeper understanding of the forces driving stock market performance. Understanding the interplay between economic data and market movements empowers investors to make more informed decisions and navigate the complexities of the stock market with greater confidence.

